Home > SEO Templates > GA4 Looker Studio Data Visualization Charts

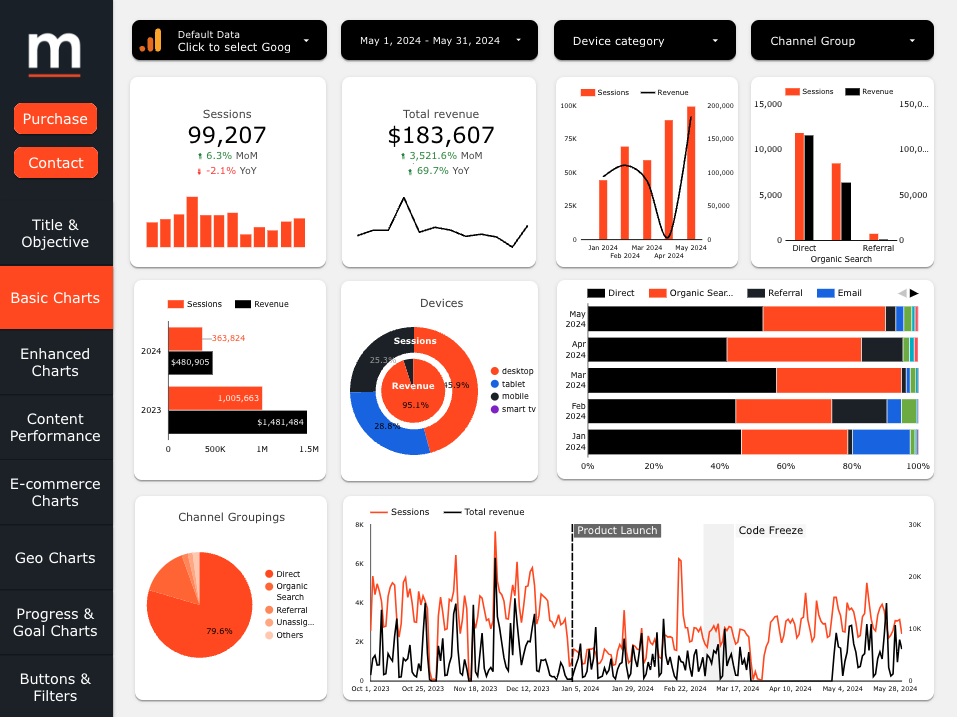
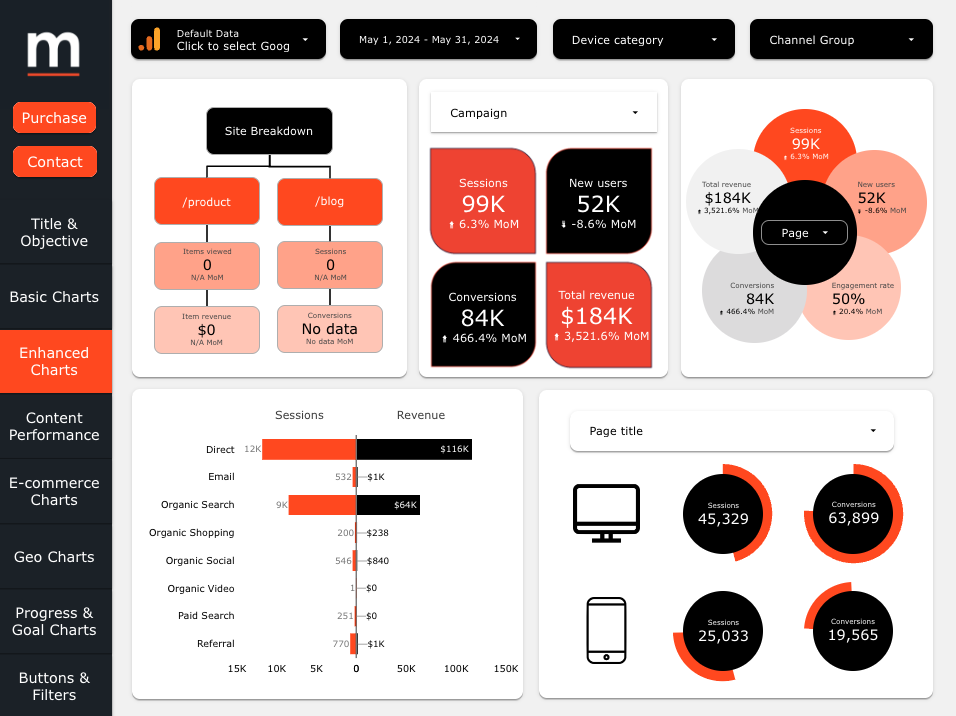
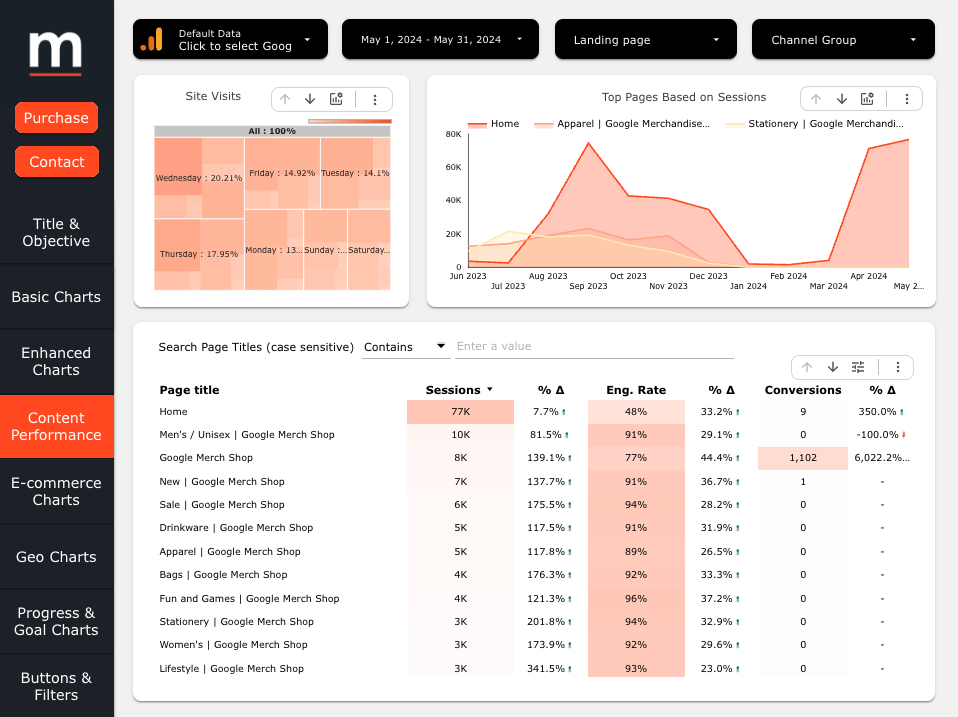
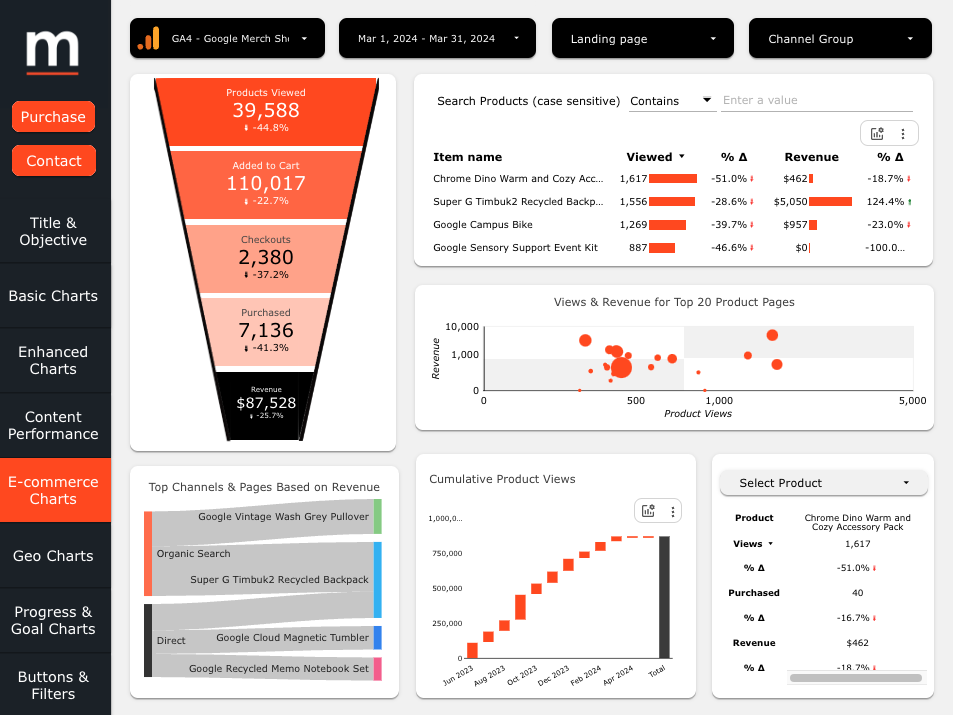
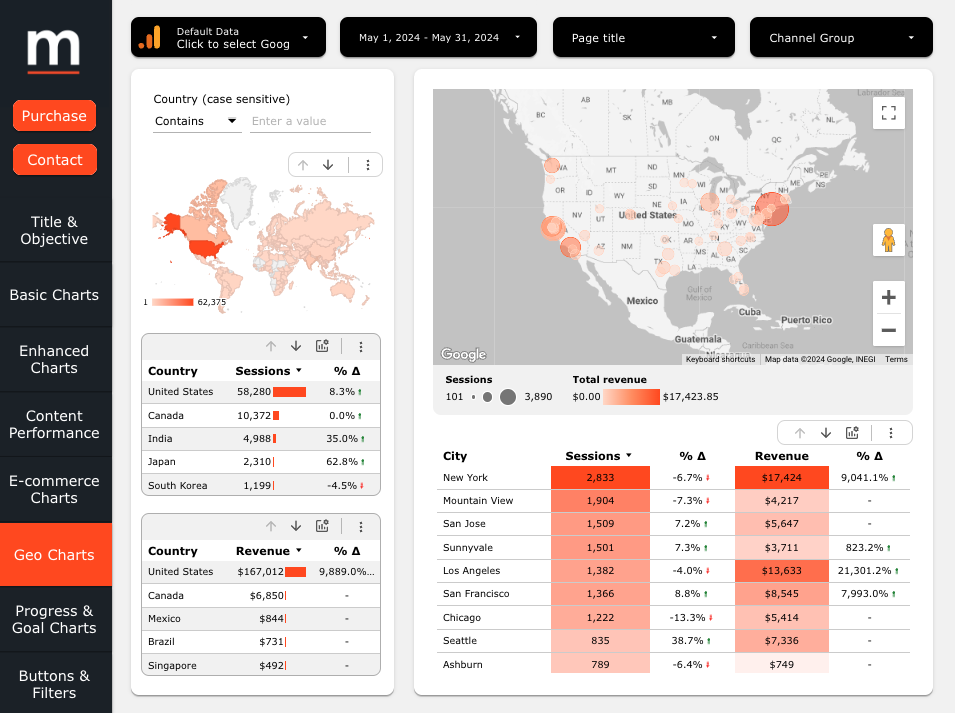
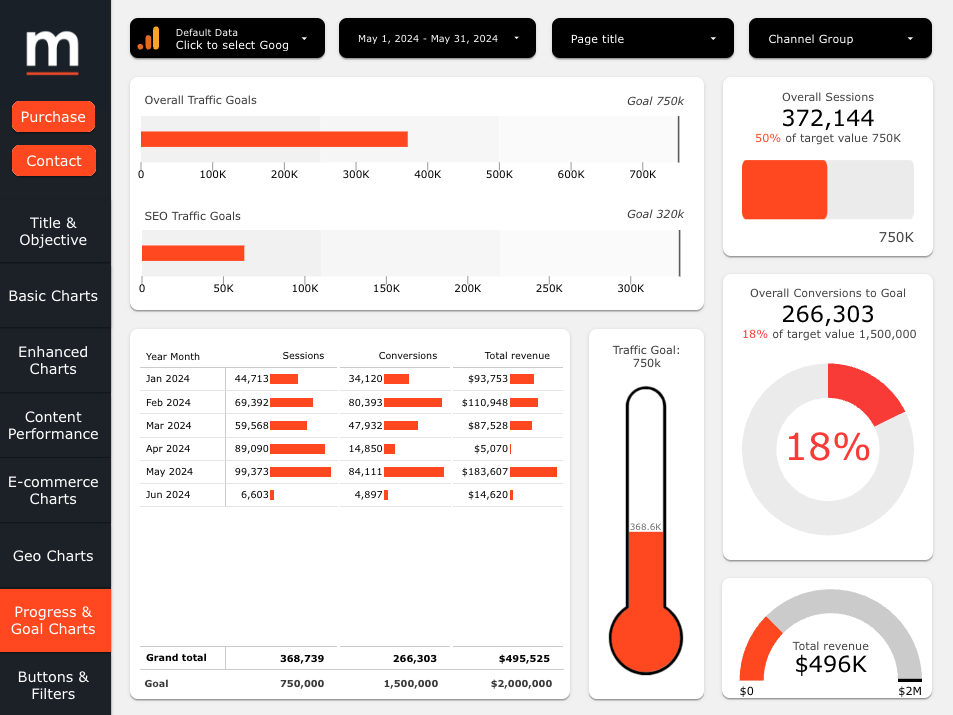
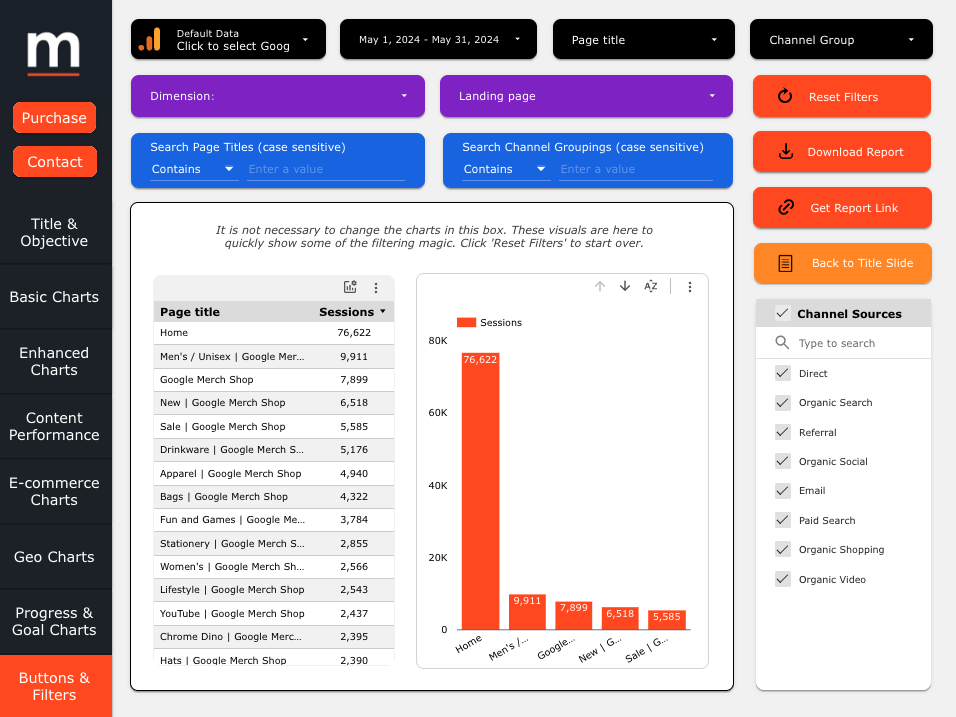
Google Analytics 4 (GA4) Looker Studio Data Visualization Charts

Designed for versatility and ease of use, this Looker Studio template provides a diverse array of data visualization charts using GA4. It offers the flexibility to create tailored reports that address your audience’s specific needs, ensuring clear and effective communication of key insights. Whether you’re tracking performance metrics, analyzing trends, or presenting complex data, this template helps you create impactful and visually appealing reports.

GA4 Data Viz Looker Studio Overview & Sections

Whether you’re a data analyst or scientist, marketing professional, or business executive, the goal is simple: to empower you to choose, tweak, and brand these charts into your own reporting and data storytelling. This template provides flexibility to tailor visualizations to your unique requirements. Whether presenting to stakeholders, clients, or team members, this template helps you effectively communicate insights and drive informed decisions.

Basic Charts

Illustrate data with bar, line, and pie charts to interpret key metrics such as sessions, revenue, device usage, and channel sources breakdown. These fundamental visualizations provide a clear and straightforward way to understand your primary data points, making it easier to track performance and identify trends.

Enhanced Charts

Choose from a set of visually elevated charts to gain deeper insights into metrics including user journeys, campaign performance, and engagement. These advanced charts offer a more detailed and nuanced view of your data, helping you uncover hidden patterns and optimize your strategies for better outcomes.

Content Performance

Analyze content reach and effectiveness to fine-tune your engagement strategies. By evaluating which pieces of content resonate most with your audience, you can adjust your approach to maximize impact and drive higher levels of engagement and conversion.

E-Commerce Charts

Investigate sales trends, product success, and customer behavior to inform e-commerce decisions. These charts provide insights into the performance of your online store, enabling you to make data-driven decisions that enhance customer satisfaction and boost sales.

Geo Charts

Integrate geographic segmentation to understand audience distribution and tweak geo-specific strategies. Geo charts help you visualize where your users are coming from, allowing you to tailor your marketing efforts to different regions and improve overall reach.

Progress & Goal Charts

Visualize targets against actual performance to keep track of key business objectives. These charts enable you to monitor your progress towards specific goals, ensuring that you stay on track and make necessary adjustments to achieve your objectives.

Buttons & Filters

Apply interactive buttons and filters for customized data views and focused analysis. Interactive tools enhance the usability of your reports, allowing users to explore the data in a more dynamic and personalized way. This feature helps to isolate key insights and drive more informed decision-making.