Google Looker Studio Templates
& Other SEO Resources
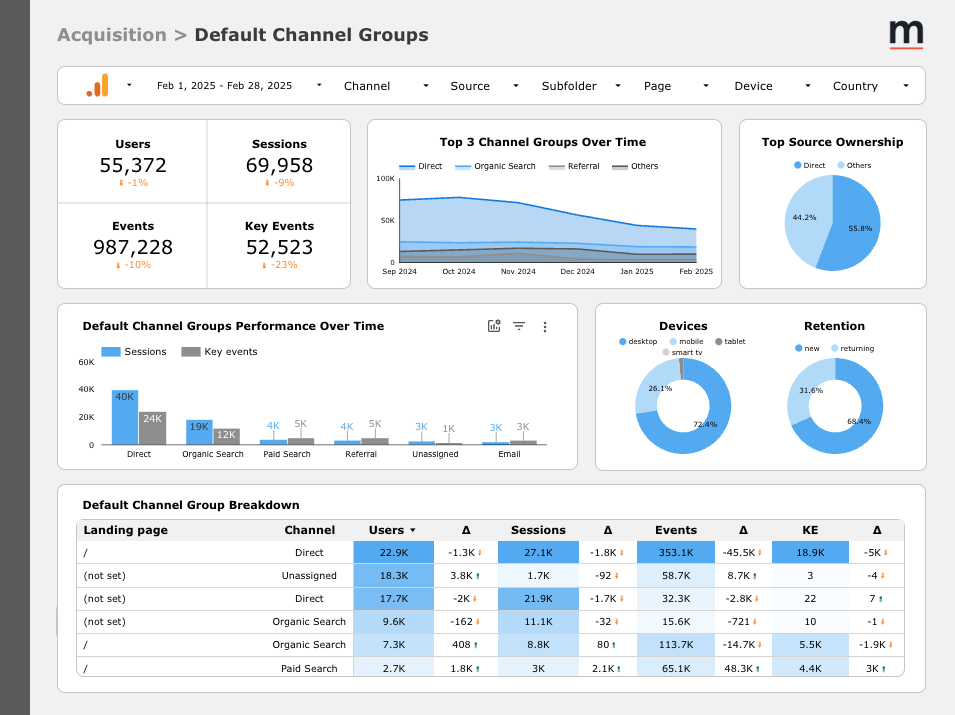
Google Analytics 4 (GA4) Marketing Report Looker Studio Dashboard
This GA4 Marketing Report Dashboard was designed to replicate the popular sections in Google Analytics. It’s built for those who frequently add secondary dimensions, offering a streamlined way to view key insights and measure digital marketing efforts. With a user-friendly interface, it helps you see what’s working, spot patterns, and dig deeper into the essential metrics that matter most. View marketing reporting data in one place; analyze campaign performance across traffic sources, audience demographics, customer behavior, and sales performance data, in just a few clicks.
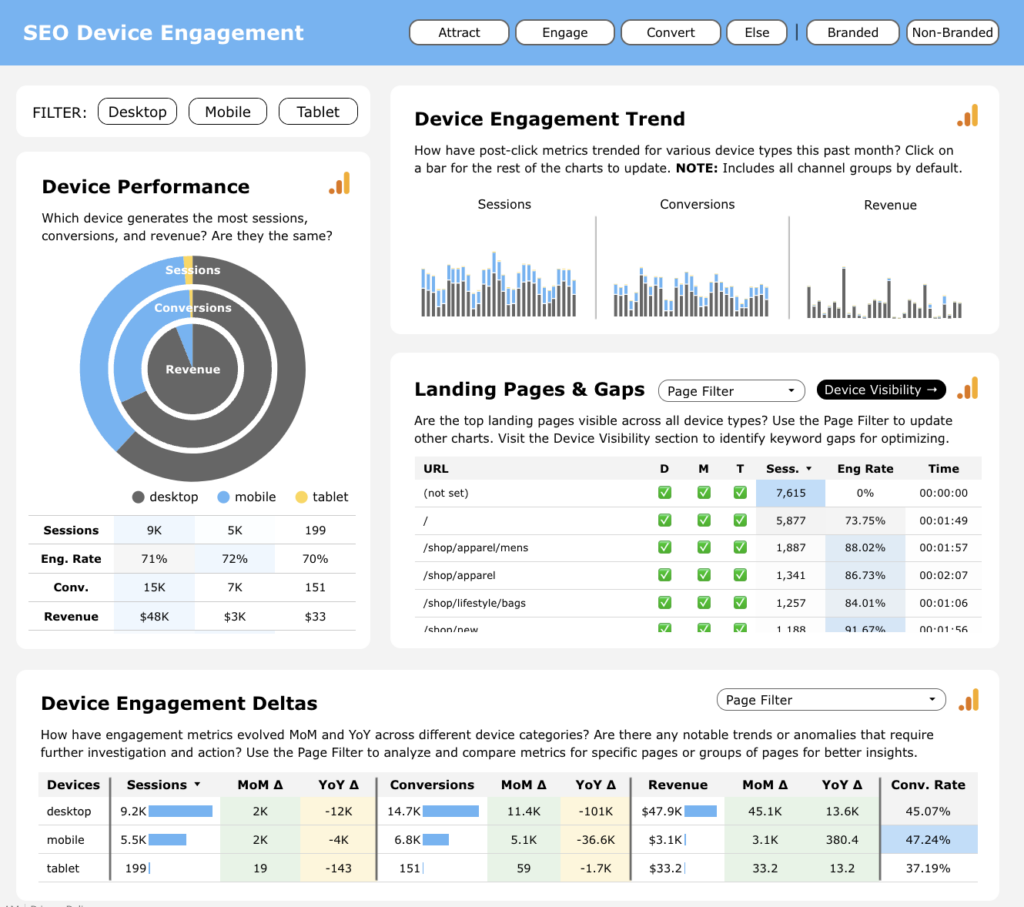
SEO Customer Journey Looker Studio Template
36 pages of data! Elevate your SEO strategy and visualize your data in new and informative ways with this Looker Studio template. Providing a seamless integration with Google Analytics and Google Search Console data sources, it’s been crafted to provide a comprehensive and high-level view of the entire customer journey, helping you gain actionable insights for more informed decision making. Ideal for digital marketers, SEO professionals, and business owners, this powerful tool tracks key metrics across the user journey, such as visibility, attribution, audience, and engagement.
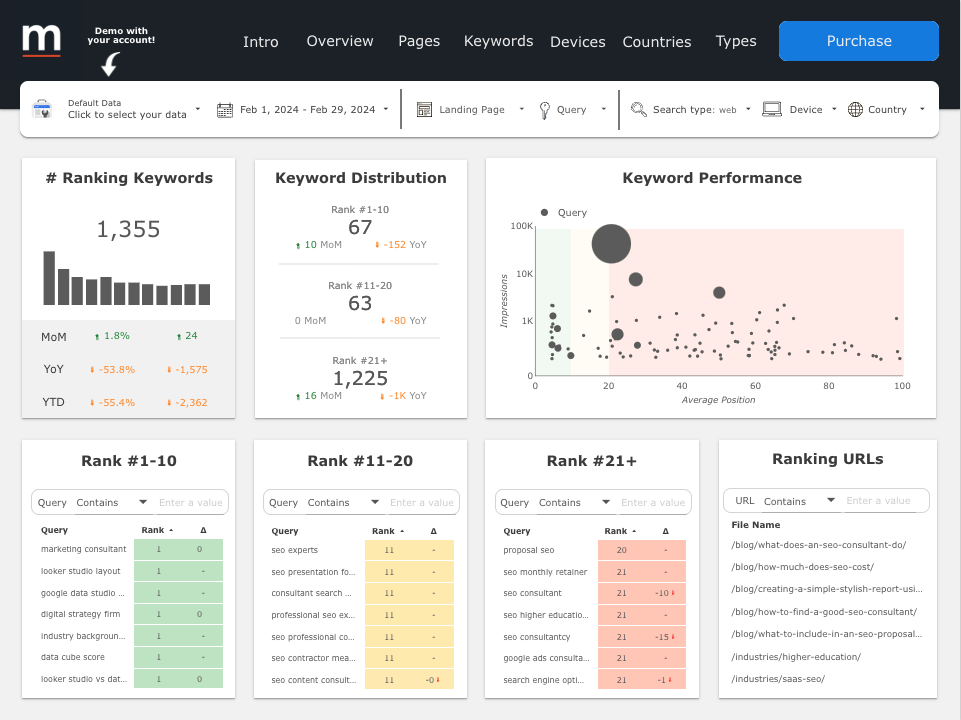
Google Search Console (GSC) Looker Studio Template on Page & Keyword Analysis
Elevate your data analysis with advanced insights. Specifically designed for deep analysis of page-level and keyword-level data from Google Search Console, this Looker Studio dashboard template is your go-to resource to track performance and craft business intelligence background insights from your search data, enabling strategic decisions that drive your website’s performance.
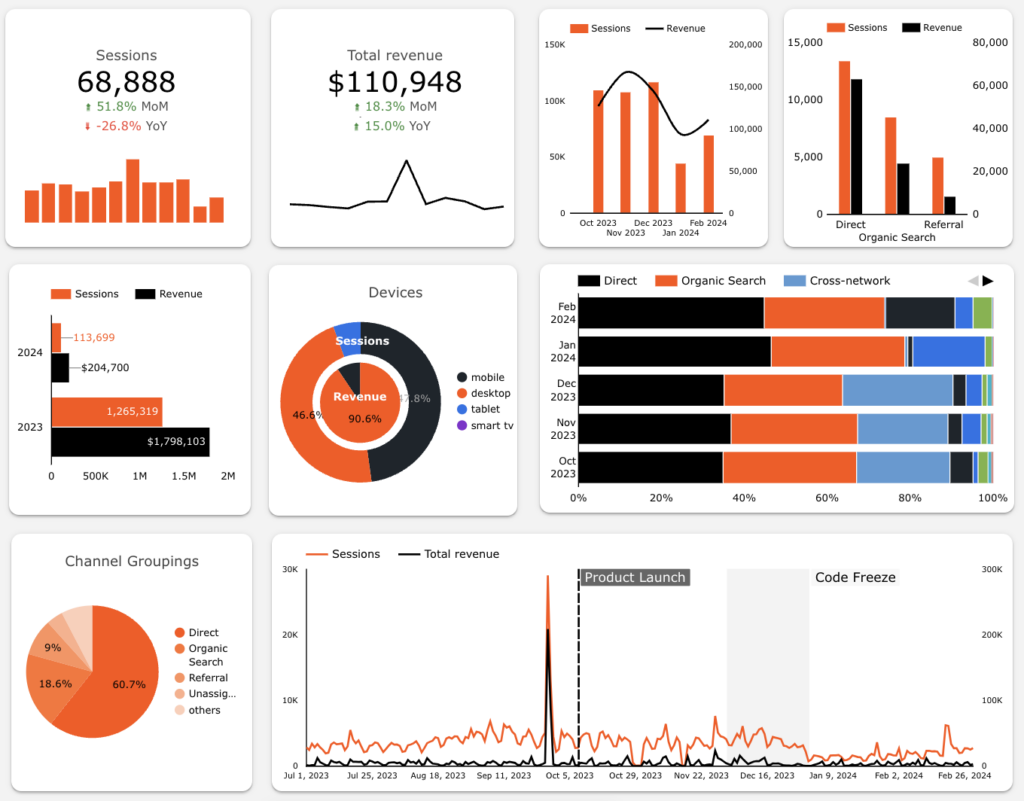
Google Analytics Looker Studio Data Visualization Charts
Save time and create impactful reports with this Google Looker Studio template. Designed for data analysts, website managers, and digital marketing professionals, this template provides a diverse array of dashboard examples and data visualization charts to track performance and derive actionable insights, giving you the flexibility to create tailored, interactive reports that speak to your target audience’s needs.
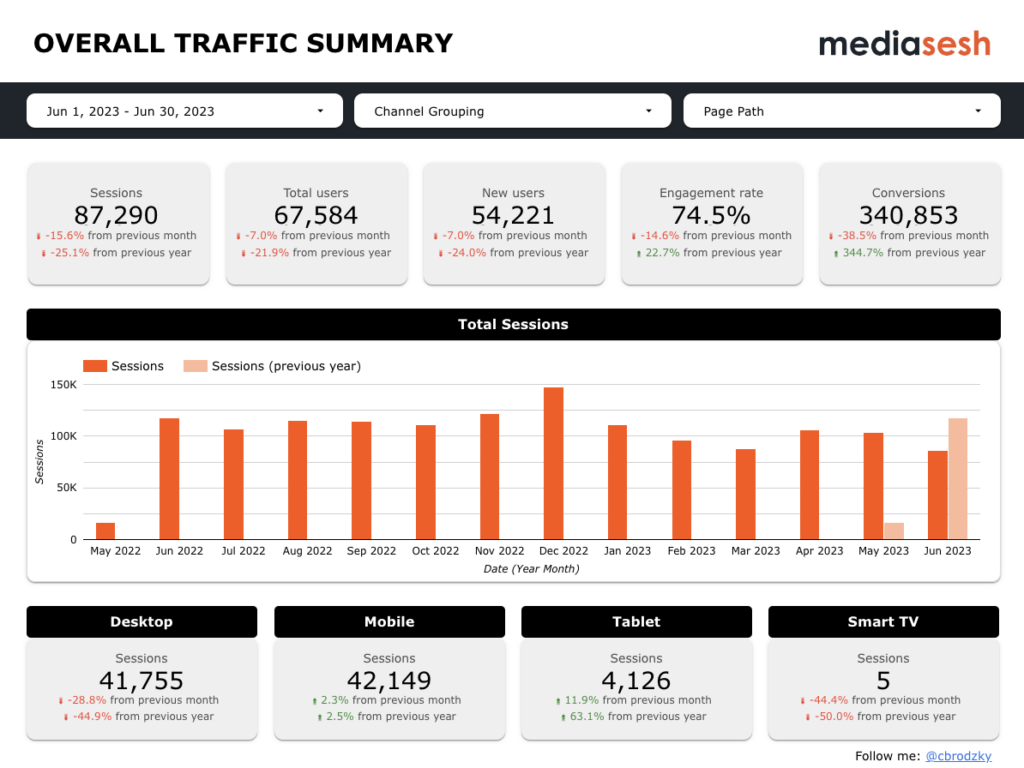
Google Analytics SEO Looker Studio Template
Unlock the full potential of your website’s analytics with this Google Analytics 4 SEO template for Looker Studio. Tailored for SEO analysts, marketers, and business owners, this template uses an intuitive interface to transform your Google Analytics data into actionable insights with ease and efficiency. Track essential metrics and gain a quick overview of SEO performance to make informed business decisions.
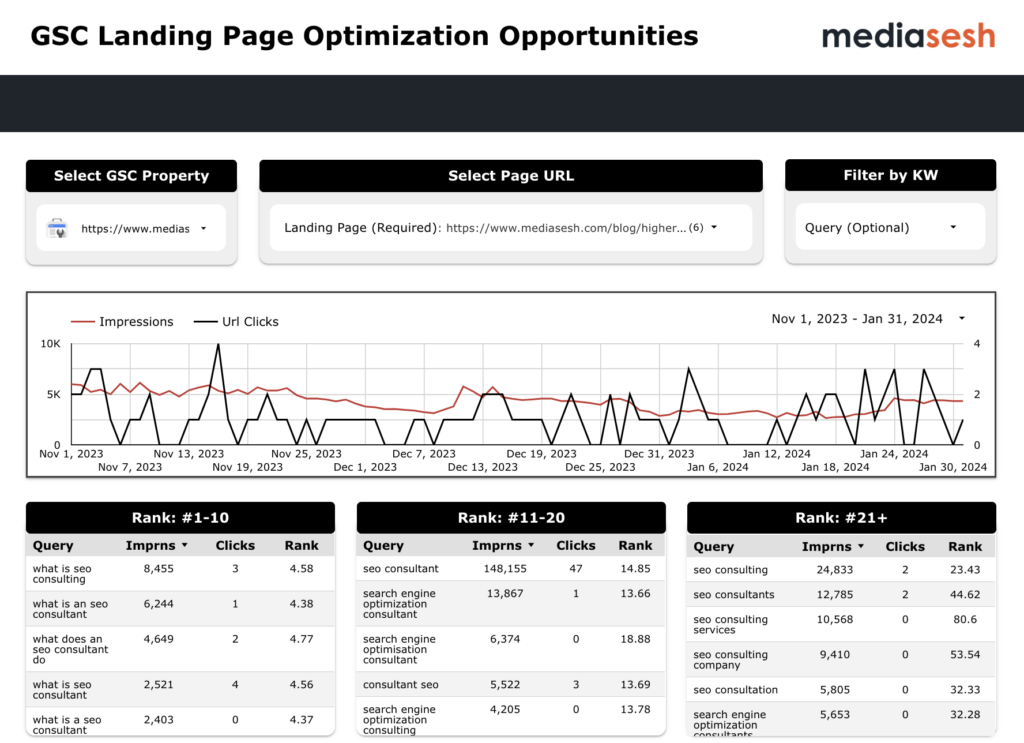
Google Search Console Looker Studio Template for Optimization Opportunities
Elevate your SEO and marketing strategy with this keyword optimization dashboard. Designed for SEO professionals, content creators, and digital marketers, this Looker Studio dashboard leverages Google Search Console data to unveil hidden opportunities for keyword optimization. Transform how you approach content and SEO with valuable insights that guide you to rank higher and capture more organic traffic.
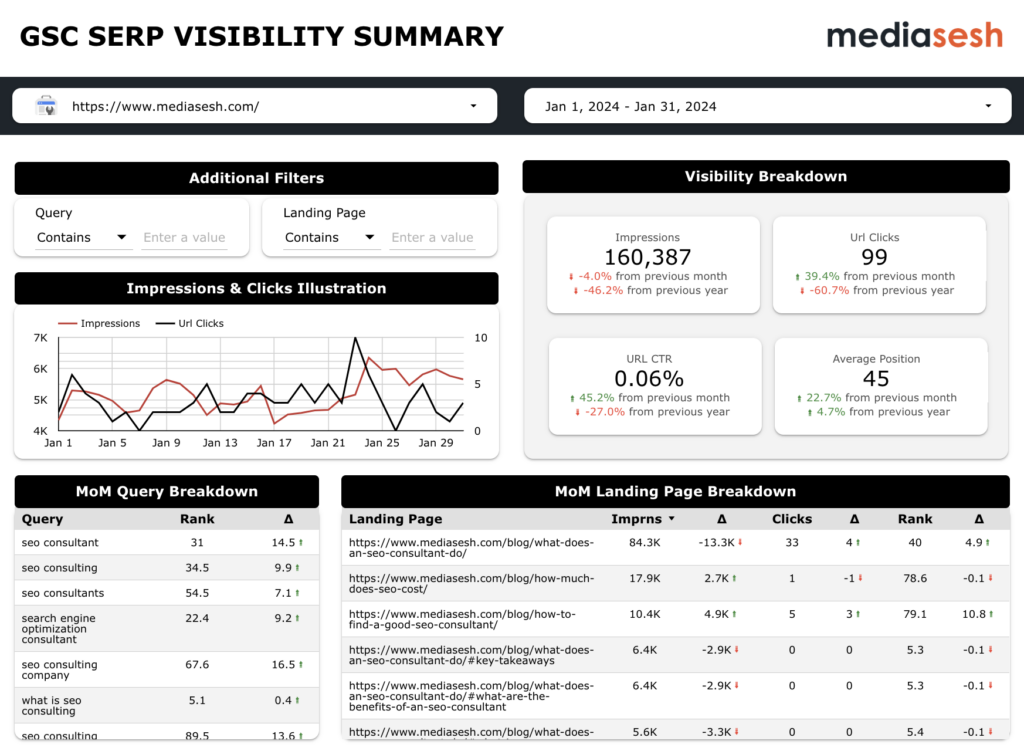
Google Search Console Looker Studio Template for SERP Visibility Summary
Maximize your online presence with this SERP visibility Looker Studio report template. Designed for SEO specialists, digital marketers, and website owners, this Google Data Studio template harnesses the power of Google Search Console data to provide a high-level view of your website’s performance in organic results. Visualize your data to derive meaningful insights and make informed decisions to enhance your SERP visibility.
Google Looker Studio Templates FAQ
What are Google Looker Studio templates?
Google Looker Studio templates are prebuilt dashboards designed to help visualize data from sources like Google Analytics and Google Search Console. They help to better understand performance trends quickly.
Why use a template over doing it yourself?
Templates help save time, reduce setup complexity, and offer a clear starting point for reporting. They may also help display data in new ways and highlight insights that are often missed in standard reports.
Are your Looker Studio templates free?
The full templates are paid, but each one includes a free demo version with limited capabilities so you can explore the layout, structure, and reporting features to see how it works before buying.
What data connectors are used?
Templates are built using Google Analytics 4 (GA4) and/or Google Search Console (GSC). They are designed for marketers, SEOs, and analysts who want to track site performance and search visibility using these tools.
How long does it take to get started?
Most people are up and running in just a few minutes. Once your GA4 or GSC data is connected, the full dashboard loads with your data and is ready to explore, filter, and use for ongoing reporting and analysis.
Do I need a paid Looker Studio account?
No, the templates work with the free version of Looker Studio. You just need access to GA4 or GSC and a Google account to connect data, customize filters, and start reporting on key website metrics and trends.
Can I track Google Ads data?
These templates are primarily designed for GA4 and GSC sources. Some templates may surface PPC data, but it’s not a main focus. If there’s enough interest, I may create a dedicated Google Ads template in the future.
Do they include audience demographics?
Some of the templates include audience information, such as location, device, language, and age range. These insights can help you better understand your target audience to adjust your strategy.
Can I track e-commerce analytics?
Some templates include e-commerce metrics like revenue, sales performance, and average order value. They’re a great option for businesses looking to monitor site activity and conversions in one place.
Other SEO Resources

SEO Accessibility Resource
As SEOs, we’re in a great place to be part of the conversation and loop in the very people we are trying to support. Here are a few ways to learn, hire and help people with disabilities.
Carving Your SEO Path Presentation
In this presentation, I focus on how you can learn more about yourself in order to find your niche, get the money you want and deserve, and how you can make a difference. There’s a place for everyone in this industry – How are you carving your path? Where do you fit in?