Ever hear this quote: “Without data you’re just another person with an opinion” (W. Edwards Deming)? For SEO, data is the thing that confirms our suspicions, eliminates guesswork, and proves our value. It’s also what we use to create impactful insights and next step recommendations.
Benefits of data in SEO
While anyone can rattle off best practices found online, it’s the data that helps to support our arguments. Here are a few ways in which data can benefit SEO:
- Show what’s at risk if we don’t do something
- Show what we stand to gain if we do
- Highlight what’s working and what’s not working
- Better align resources by prioritizing what needs to be worked on
- Create marketing budgets for proposed work
- Build confidence in your business during pitch meetings
Examples of how SEO data can inform next steps
1. Prioritize SEO content writing based on search volume
Without content, there is no SEO. And without SEO, there’s a risk that content may not be found. Let’s face it: we need each other.
To make content writing worth the time, resources, and money (at least from an SEO perspective), it’s a good idea to prioritize topics that people are searching for in search engines.
One way to do this is by addressing the ‘who, what, where, when, why, how’ questions, and looking to see what the search volume is. Another angle is addressing comparative searches (e.g. ‘this’ versus ‘that’).
For example, let’s pretend I sell coffee products. Here are a few topics I may consider writing about when using tools such as SEMRush, Ahrefs, Conductor, and Answer the Public:
| Topics | Search Volume | Current Rank |
|---|---|---|
| What are the benefits of drinking coffee? | 590 | N/A |
| Instant coffee vs brewed coffee | 390 | N/A |
| What is the best way to brew coffee? | 110 | N/A |
| How to store coffee beans to keep fresh? | 20 | N/A |
| What is cold brew coffee vs iced coffee? | 20 | N/A |
I want to point out that it’s totally fine to write about a topic with a small search volume. For some businesses, it’s more realistic to go after those verses topics with a higher search volume.
Topics with a small search volume can also be valuable since they can have more commercial intent. This is when users are looking for more information with the goal of eventually buying.
Using the examples above, how to store coffee beans to keep fresh (SV: 20) would have more commercial intent than what are the benefits of drinking coffee (SV: 590). That could mean 20 potential eyeballs that turn into 20 purchases.
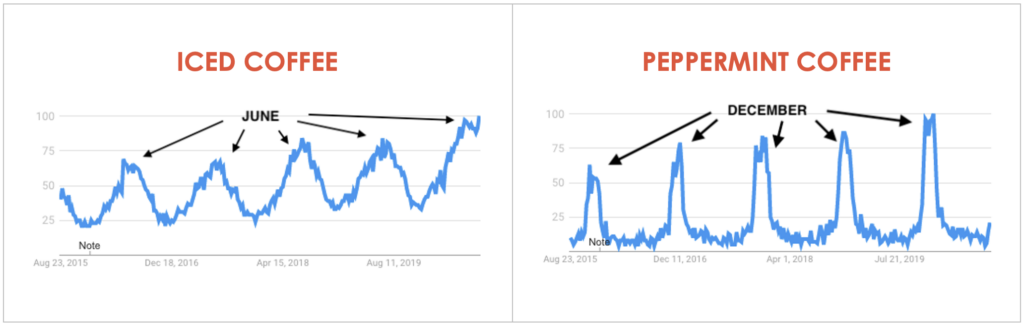
On top of that, another source of data to consider is Google Trends. This can inform when to write content. Using my coffee example above, I can see iced and peppermint coffee are popular during different times of the year.
Expanded image description
Side-by-side line charts with screenshots from Google Search Trends. The line chart on the left is titled “Iced Coffee” and has arrows during the June months to illustrate an increase in search demand during that time. The line chart on the right is titled “Peppermint Coffee” with arrows pointed to the December months to illustrate an increase in search demand during that time.
Based on the data, I will suggest that content be written a few months prior to peak time. That way I can give them time to get indexed and ranked in Google.
I will also add the keyword phrase into a tracking tool, such as AuthorityLabs or Rank Trackr, to see how they trend over time. If they don’t rank well after some time, that will help to inform more next steps.
2. Address technical errors that are negatively impacting user experience
We work so hard to get people to our sites. Why lose them because the site provides a poor user experience? Technical implications can have a negative impact on keyword rankings, thus an impact on organic traffic and conversions.
One way to improve the user experience is by making sure the website loads quickly. According to Big Commerce, a 1-second delay in page load time has shown a 7% loss in conversions. For large websites, that can be significant.
Use a tool such as Google’s PageSpeed Insights to identify page speed errors. The image below shows that it takes this one client site about 6 milliseconds for the first meaningful asset to load. That’s just enough time for my visitor to already be on a competitor’s website.

Based on this, you will provide the top page speed items that should be resolved. Every site is different, but there are the typical usual suspects, such as: eliminating render-blocking resources, removing unused JS/CSS, using a CDN, and caching static content.
Another way to improve the user experience would be by addressing errors related to Web Core Vitals. This was part of Google’s new Page Experience Signal that was rolled out. Of course, prioritize this as you would with any other technical error based on impact, level of effort, and the number of pages affected.
From there, you can use tools such as Google’s Page Speed Insights and web.dev to identify which errors need fixing. From my experience so far, most opportunities have revolved around removing unused JavaScript/CSS and properly resizing images.
3. Monitor inbound links to expose sites that are friend or foe.
Inbound links from quality sources help to increase a site’s authority. It’s a ‘vote of confidence’ that says your site is so valuable that others are willing to link to it.
Monitoring inbound links is a way to keep a keen eye on how others are sharing your content. This can impact your next steps, such as building new partnerships or protecting yourself against a potential spam attack.
Tools such as SEMrush, Moz, Ahrefs, or Majestic can help with discovering new and lost links. Check on inbound links at the very least once a month, or more if things are looking suspicious.
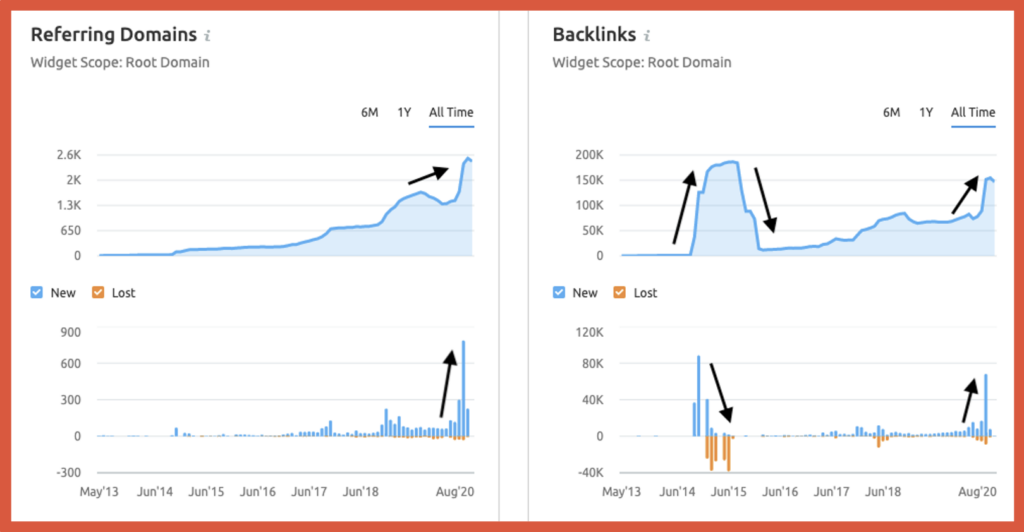
The image below shows an old client that experienced a few instances of significant increases and decreases of inbound links.
Expanded image description
A screenshot from Semrush with side-by-side and top and bottom charts. The two charts on the left are for referring domains. The chart on the top shows consistent growth in traffic to the root domain while the chart on the bottom shows new and lost links with an influx of links in August 2020. The two charts on the right are for backlinks. The chart on the top shows a couple of influxes in root domain backlinks, while the chart on the bottom shows a couple of areas of volatile new and lost links.
From here, you’ll want to investigate where the links are coming from and what pages they’re linking to on your site. In this case, the most recent influx was due to a podcasting site with poor taxonomy.
As quickly as those pages appeared, SEMrush was showing that those pages have since been removed. I anticipate the number of inbound links to decrease because of that.
4. Ensuring analytics provides an accurate depiction of site engagement
As I’ve mentioned, monitoring data is a must for SEO since it informs next steps. But how can we inform next steps when the data is skewed?
Fun discoveries can pop up in our analytics data from time to time. It’s up to us to then make the necessary adjustments, such as new filters or channel groupings. This will help us to make better decisions based on a more accurate depiction of how visitors are engaging on our site.
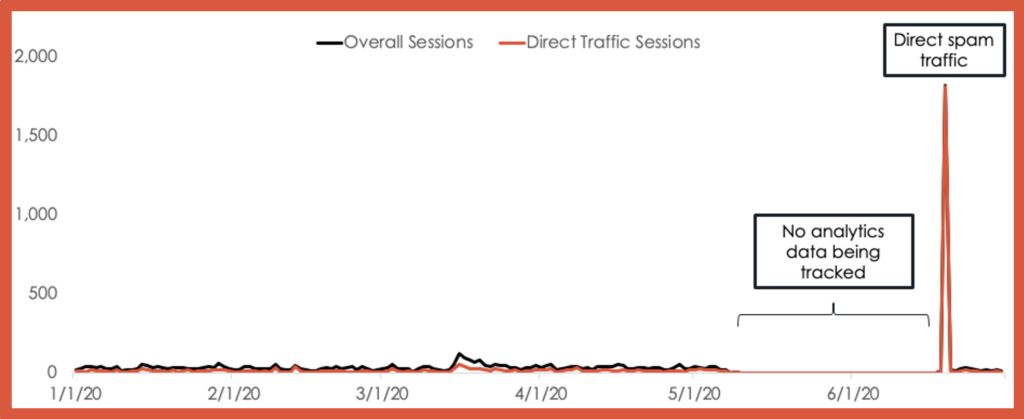
The image below shows a couple of Google Analytics discoveries during a recent client pitch. They had gone through a site migration and forgot to add GA code to the new site – for a whole month!
There was also an influx of direct traffic, which was due to spam. It’s possible this could have been prevented had they checked the box to remove known bots in the admin console long ago.
Expanded image description
A line chart with two lines: one in orange for direct traffic sessions and one in black for overall sessions. Traffic for both lines was similar until January 2020 when the lines were gone due to no data, then a spike in both lines for direct spam traffic.
This can inform the next step to have a Google Analytics audit. It should also necessitate the need for someone to monitor analytics to spot threats sooner rather than later.
Final thoughts
Data is everything when it comes to SEO. I only showed a few small examples of what data can do, but it doesn’t end here. Use tools, such as the ones mentioned above, to monitor your website. You can also check out some of my Google Looker Studio templates to help keep track of metrics.
I should also mention that many of your next steps will be experiments. You know the saying: if you’re not testing, you’re guessing. We may have a good idea of what will work, but past performance is not an indication of future success. Whatever changes are made to the website, annotate it in Google Analytics. That way you can correlate shifts in keyword rankings and analytics data to SEO changes.
It’s also possible during your research to feel analysis paralysis. When this happens, I recommend starting with the nuggets of data that jump out at you. Look for those noticeable increases and decreases that look interesting. Then do a deep dive from there.
Related Articles: